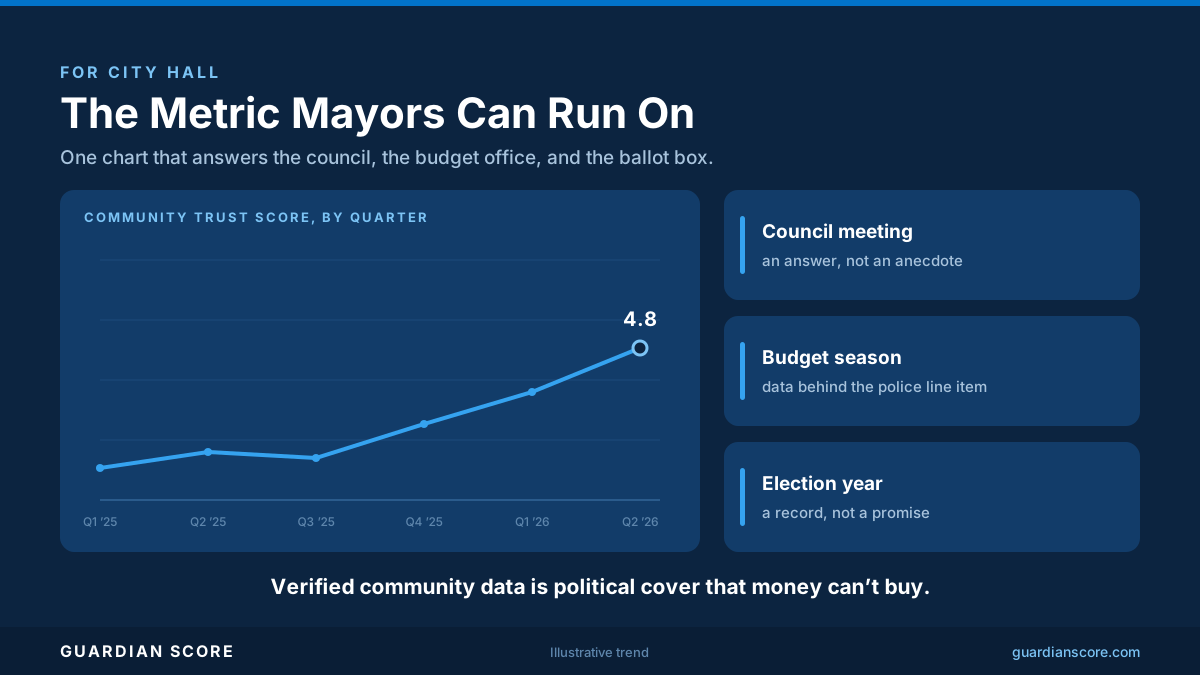
When public safety comes up at a council meeting, most cities answer with crime stats and anecdotes - one number that measures what went wrong, and one story that could be countered by a different story. Neither tells an elected official whether residents actually trust the officers they're funding, and neither survives a hostile question from the dais.
This infographic shows what changes when a city has a trust score trend instead. At council meetings, the police discussion opens with a verified number that moves month over month, drawn from residents rating real encounters. In budget season, the department defends its request with evidence of performance, not just headcount. And in an election year, "what have you done about policing" gets an answer with a chart behind it rather than a press release. The trend line matters more than any single reading - it shows whether things are getting better, and it keeps working when the news cycle turns. Put it in front of your mayor or city manager before the next budget hearing, or bring it to the council workshop where the department's numbers get set.
For how the underlying score is built and validated, see How to Measure Community Trust in Policing.