CompStat changed policing because it forced one discipline: nobody argues from anecdote when the numbers are on the wall. Crime, response times, clearance rates - all managed against a trend line, reviewed on a cadence, owned by commanders. Then the same chiefs walk into a council meeting and answer questions about community trust with a story and a hopeful tone, because trust is the one core outcome no dashboard covers.
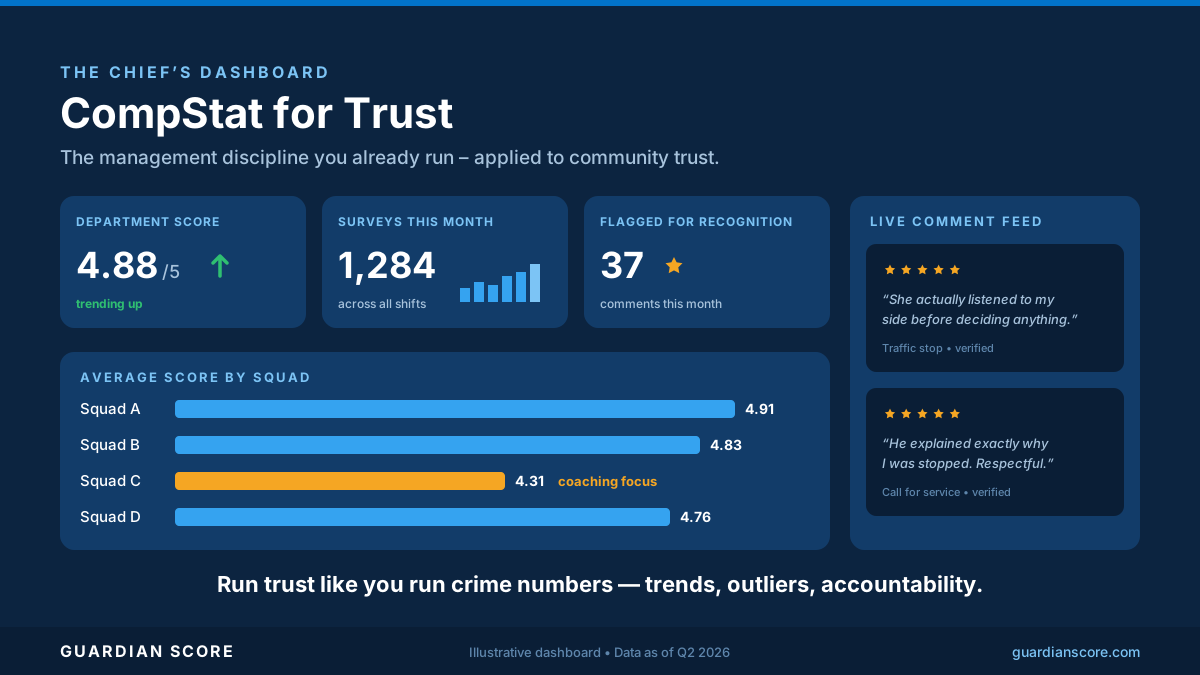
This infographic shows what closes that gap: KPI tiles tracking your trust score against last quarter, squad-by-squad comparisons that surface where coaching is working, and a live feed of verified community comments - two-thirds of surveys include one - so the numbers never lose their human texture. It's the same management posture you already hold, pointed at a new outcome. Put it up in your next command staff meeting and ask the question it implies: if we manage crime this rigorously, why do we manage trust by feel?
The dashboard in the graphic is real - walk through the tiles, comparisons, and comment feed on our analytics feature page.